My SimplyTweet Punch Card
I use GitHub to manage my code and I thought it’s interesting to look at my commit activity for SimplyTweet. GitHub has an excellent tool for this called Punch Card. This is how it looks like for SimplyTweet:
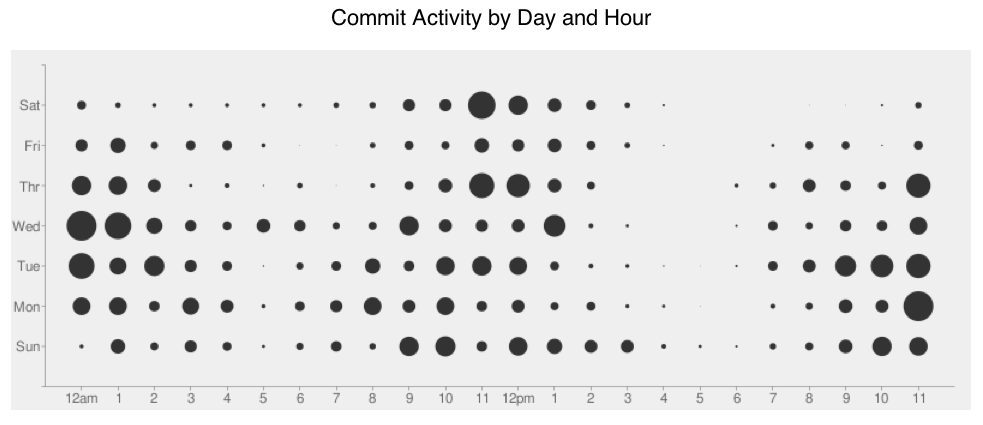
It shows the relative number of commits (rough equivalents of changes if you are consistent) performed across the duration of the project. You can see that
- I am most productive (again, commit-wise) the few hours around 12am and 12pm.
- I am least productive on Fridays.
- I seem to be slightly more productive during midnight than noon.
- I work on Saturday nights.
- I work on Sunday nights
- I work everyday.
Does anyone else has Punch Card graphs they like to share?